
Laatste update: 02/11/2026
Kies in het printvenster bij bestemming "Bewaar als PDF". Deze pagina wordt opgebouwd uit de actuele handleiding, dus je krijgt altijd de nieuwste versie.
Afgedrukt op 21 November 2026.
Laatste update: 02/11/2026
De voetafdrukmodule brengt in kaart waar je vandaag staat. Je vult per jaar in wat je verbruikt hebt aan energie en water, en hoeveel gasten er waren. Daaruit berekent het platform je verbruik en je CO₂-uitstoot per persoon per nacht, en vergelijkt het je anoniem met logies die op het jouwe lijken.
Wat de module wel en niet meet
Wel: elektriciteit, gas, stookolie, pellets, zonne-energie, warmtepomp en andere energiebronnen, plus je waterverbruik. Daaruit volgen je CO₂-uitstoot uit eigen verbranding (scope 1) en uit ingekochte energie (scope 2).
Niet: afval, voeding, de mobiliteit van je gasten, biodiversiteit. Dat is een bewuste keuze, geen vergetelheid. Zie Wat een voetafdruk is, en wat niet.
De route in het kort
- Je maakt een logies aan, of je logies staat er al.
- Je maakt een rapportagejaar aan van twaalf maanden.
- Je vult je bezetting in: kamernachten en persoonsnachten.
- Je voert je energie- en watermetingen in, of je laat ze automatisch ophalen uit EnergyID.
- Je publiceert het jaar. Vanaf dan zie je de benchmark.
- Je maakt een rapport en een infographic.
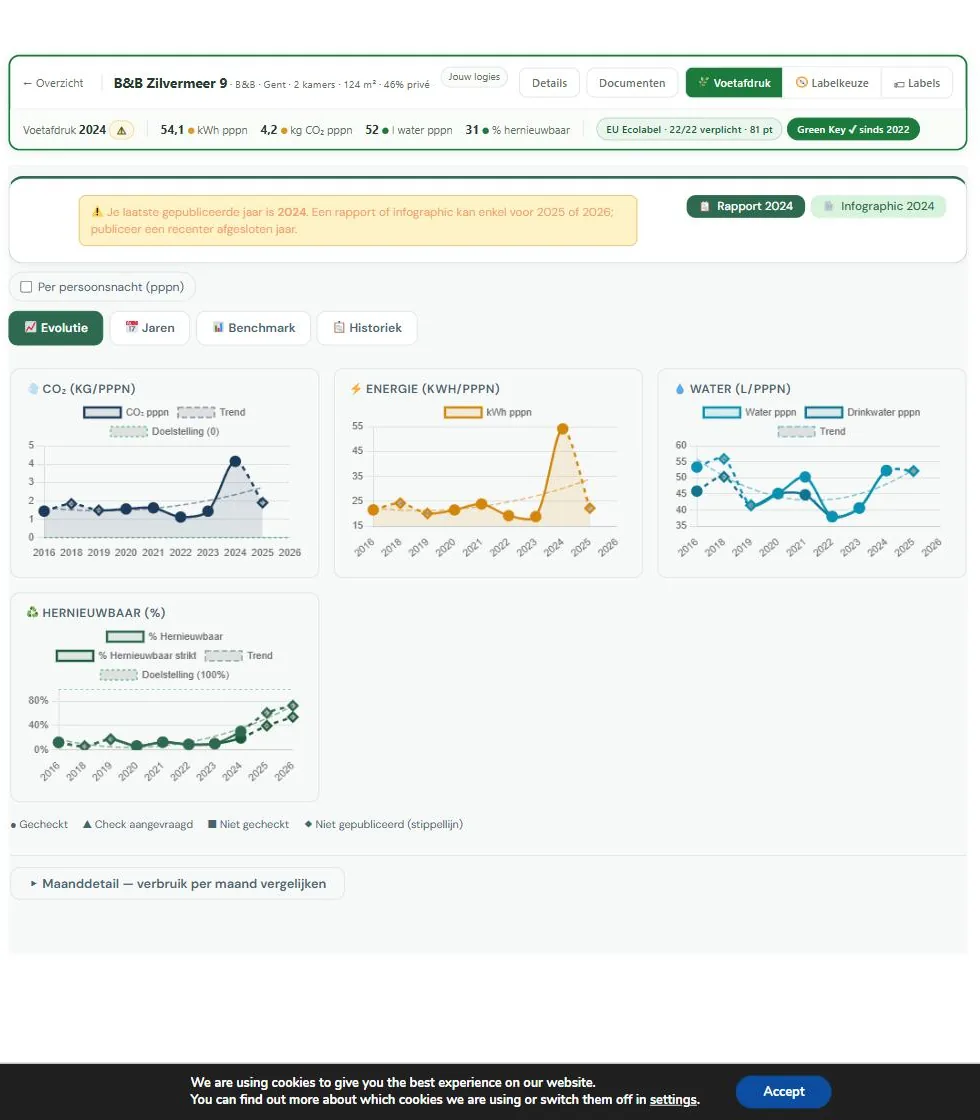
Stap 1 tot 4 kosten de meeste tijd, en alleen de eerste keer. Het jaar erop is het grotendeels bijwerken.
Wat je nodig hebt om te beginnen
Je adres, je bezettingscijfers, je jaarverbruik elektriciteit en gas, en je waterverbruik. Meer niet, om te starten. De rest kan je later aanvullen.
Wil je eerst zien wat het oplevert, begin dan met Snel starten. Wil je eerst alles verzamelen, kijk dan bij Welke gegevens heb je nodig.
Hoeveel tijd het kost
Reken op een half uur voor een eerste resultaat als je je facturen bij de hand hebt. Een volledig ingevuld jaar met alle energiebronnen, documenten en maandgegevens kost eerder twee tot drie uur, verspreid over enkele momenten.
Verder lezen
Quick start: your first report in thirty minutes
Laatste update: 02/11/2026
Want to see what this gets you before investing a lot of time? With just four pieces of data, you can already reach an initial result.
Check this first
You need recognition from Toerisme Vlaanderen to be able to publish. Without recognition, you can fill in and view everything, but your accommodation won’t be included in the benchmark.
What you need at a minimum
- Your address. With this, the platform automatically retrieves the name, type, and number of rooms from Toerisme Vlaanderen. If you live in the building yourself, keep your percentage of private use handy as well.
- Your occupancy: room nights and person nights. The easiest way is to upload your monthly Statbel declarations; the platform will add them up for you.
- Your annual electricity and gas consumption. You can find this at a glance on Mijn Fluvius.
- Your annual drinking water consumption in m³. This is on the bill from your water company.
A full list of everything you can fill in can be found under What data do you need.
Step by step
- Create an account and log in.
- Add your accommodation with your address and have the data retrieved from Toerisme Vlaanderen.
- Create a reporting year, usually the year that has just ended.
- Fill in your occupancy, or upload your Statbel files.
- Enter electricity, gas, and drinking water. If your consumption is already in EnergyID, you don’t have to retype anything.
- Publish the year.
- View your benchmark and create your report.
Ready to start? Open the footprint module ⧉
No stress
You don’t have to finish everything at once. What you fill in is saved, and you can complete it later. If an energy source is missing, the rest remains accurate.
Only publishing requires a complete year. As long as you don’t publish, nothing is final and nothing counts towards the comparison.
Further reading
What information do you need
Laatste update: 02/11/2026
Before you start, it’s useful to have your details at hand. Here is a breakdown of what you need and where to find it.
Accommodation details
Your address is enough to get started: the platform uses it to retrieve the name, type, number of rooms, and your registration from Toerisme Vlaanderen. You can fill in the rest yourself:
- Surface area of the building in m².
- Percentage of private use. If you live in the building yourself, that part does not belong to your accommodation. Estimate it based on surface area: if you occupy 60 of the 200 m², that is 30%.
- Number of beds in addition to the number of rooms.
Occupancy data
Room-nights and person-nights over the full year, as a yearly total or per month. Sources: your Statbel declarations, your booking system, or your guest register. See Filling in occupancy.
Energy consumption
- Electricity in kWh per year, and separately your export to the grid if you have solar panels. Both can be found on Mijn Fluvius.
- Gas in kWh, as it appears on your annual statement. The platform does not accept the figure in cubic meters from your gas meter.
- Solar energy: the total yield of your panels, from your inverter’s app.
- Heat pump: the electricity consumption plus the SCOP of the device.
- Other sources: heating oil, LPG (propane or butane), wood or pellets, solar thermal, own wind turbine, hydrogen.
- Your EAN number. Found on your invoice and on the digital meter. Optional, but handy.
Water consumption
Your drinking water consumption in m³, from your water distributor’s statement, their customer portal, or your meter. If you have a rainwater tank or your own well with a meter, note those separately.
Optional data
Not required to start, but useful for a richer report:
| Data | Purpose |
|---|---|
| EAN number | Automatic check if you purchase green electricity |
| Website URL | Analysis of how you communicate about sustainability |
| Existing labels | Context in your report and label selection |
| Score on Booking.com or Google | Link between sustainability and guest experience |
If something is missing, start anyway. You can always add more later, and an incomplete year still provides a useful picture. Only publishing requires a complete year.
Read more
Creating a reporting year
Laatste update: 02/11/2026
Your footprint is always calculated per full year. Twelve months, no more and no less, because otherwise you can’t compare yourself with other accommodations.
Where to find it
- Open your accommodation and go to the Years tab.
- Click on + New year at the top right.
- Choose the year and fill in your occupancy.
Why per year
Consumption fluctuates significantly throughout the year: heating in winter, cooling and more guests in summer. Only a full year provides a meaningful figure, and it’s the only way to compare two years side by side.
Adding a year
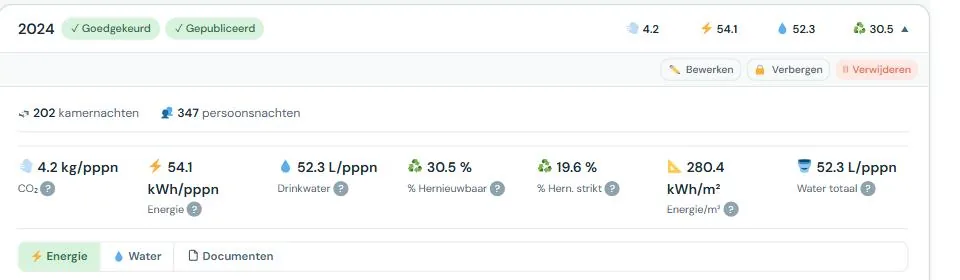
In the footprint screen, you’ll find the Years tab. There you’ll find the button to add a new reporting year. You choose the year and fill in your occupancy; the rest follows after that.
A non-calendar year
The reporting period doesn’t have to be a calendar year. If your financial year runs from April to March, or if your billing aligns better with another period, that’s possible. The condition remains twelve months.
Choose a period once and stick to it. If you shift it later, you’ll be comparing apples to oranges, both with yourself and with the benchmark.
Multiple years side by side
You can create as many years as you have data for. The more years, the more meaningful your evolution. Two years is the minimum to see a trend; three or more makes it clear if a change is lasting.
If you use EnergyID, Retrieve data will automatically create the years for which EnergyID has figures, starting from the oldest year you already have. If you want to go further back, first create the oldest year you want and then click Retrieve data. See Automatic filling via EnergyID.
Deleting a year
Deleting is possible, but think first. Documents that were only attached to that year and aren’t referenced anywhere else will disappear too. Documents that are also linked elsewhere will remain.
If the year was published, it will also disappear from the benchmark. This has consequences for the comparison group of other operators, so only do it if it’s really necessary.
Read more
Entering occupancy
Laatste update: 02/11/2026
Your consumption alone doesn’t say much. A forty-room hotel naturally uses more than a four-room B&B. To make a comparison possible, the platform divides your consumption by your occupancy. Without occupancy figures, there is no footprint and no benchmark.
Where to find it
- Open your accommodation and go to the Years tab.
- Click to open the year and then click ✏️ Edit.
- In the Edit period window, enter room nights and person nights, or click Import from Statbel.
In the same window, you’ll also find the checkboxes for laundry and for charging electric vehicles.
Room nights and person nights
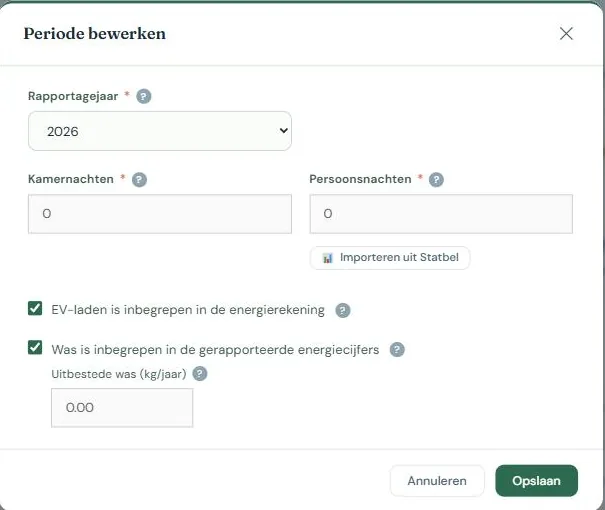
Two numbers, both covering the entire reporting period.
Room nights is the number of rooms that were occupied, multiplied by the number of nights. Three rooms that were each occupied for ten nights gives 30 room nights.
Person nights is the number of guests multiplied by the number of nights they stayed. A family of four staying for three nights gives 12 person nights.
Your footprint is expressed in both: per person per night (pppn) and per room per night (prpn). Person nights are fairer for comparing different accommodations, while room nights say more about how efficiently your building is running.
Fill in both if you have them. If you only have one, the platform will work with what you have, but part of the comparison will be lost.
Occupancy per month
In the Edit period window, there is a button 📅 Occupancy per month. This opens twelve rows for room nights and person nights, with a running total and its own save button. As soon as there are monthly figures, your annual total is the sum of those months, and it grows with every month you add. For a current year, this is therefore a year-to-date figure. This is fine: you cannot publish the current year yet anyway.
If a month remains empty while later months are filled in, you will receive a warning. Usually, that month has been forgotten, meaning your annual total is too low. If you were actually closed that month, you can proceed.
If you are a seasonal business, check This year is fully entered as soon as all the months you were open are in there. Then the platform knows that the empty months are not forgotten months, and the warning disappears.
The platform never automatically adjusts a published year. If you want to change the annual total there, you do so in the period form, and the year will then be unpublished.
Import from Statbel
If you report your accommodation figures to Statbel monthly, you don’t have to retype anything. You upload the Statbel PDFs and the platform puts each month in its place under the monthly occupancy. Your annual total is the sum.
You will first see what happens per month: new, will be adjusted, unchanged or remains, with the current and new figures side by side and the consequence for your annual total. The figures are only applied once you confirm. Months not in your files remain as they are, so you can safely upload a single month later. Uploading the same file twice does not count double. If something isn’t right, you can correct it manually.
If the files belong to a different year than the one you are editing, the platform will warn you in that proposal.
If you manually entered the annual total for an unpublished year without monthly figures, and then upload one month, your annual total will become the sum of the months—meaning just that one month. The proposal shows this beforehand with both figures. In that case, upload all months or fill in the missing months yourself.
Statbel counts a stay in the month the guest departs. This makes almost no difference to an annual total, but it does at a monthly level: a stay ending on January 2nd counts entirely towards January. Therefore, monthly figures per person night are only indicative.
The uploaded files are stored with your accommodation and are only visible to you and the people you share the accommodation with.
Manual entry
If you don’t have a Statbel declaration, you enter the two numbers yourself. Sources that are usually sufficient: your booking system, your guest register, or your tourist tax declaration.
When in doubt, it’s better to be conservative than too generous. Occupancy figures that are too high make your footprint look artificially favorable, and you’ll be comparing yourself against an incorrect figure.
Laundry and electric vehicle charging
Two checkboxes that affect your footprint:
- Laundry included. If you do the laundry yourself, that consumption is included in your energy figures. If you outsource it, it isn’t, so you specify the number of kilograms of outsourced laundry. This keeps the comparison fair against accommodations that do their own laundry.
- EV charging included. If guests charge their cars at your place, that electricity is in your meter reading even though it has nothing to do with your accommodation. By indicating this, the platform can take it into account.
Who sees your occupancy figures
Only you and the users you explicitly share this accommodation with. They never enter the benchmark as an individual figure: only the result per person night is counted anonymously. See Comparing without revealing your data.
Common mistakes
- Swapping room nights and person nights. Person nights is almost always the larger number.
- Only filling in the summer. The figures must cover the entire reporting period, including the months you were closed.
- Entering the number of bookings instead of the number of nights. A booking of four nights counts as four.
Read more
Enter energy and water measurements
Laatste update: 02/11/2026
For each energy source and water type, you enter what you consumed that year. The platform automatically converts everything to kWh and kg CO₂e, so you don’t have to calculate anything yourself. Those CO₂ figures also include the extraction and transport of the fuel, not just the combustion at your location; see How we calculate. You can find the measurements in the footprint screen, under the year they belong to, in the Energy and Water tabs.
If you have an EnergyID account, read Automatic entry via EnergyID first. Then you won’t have to do most of this manually.
Adding an energy measurement
The entry form is located below the table with existing measurements. You fill in:
Energy type. Choose from the list, for example Electricity (Grey), Gas, or Own solar energy. The type determines which emission factor is used for the calculation, so choose accurately. If you are unsure between Electricity (Grey) and Electricity (Green with GOs), check the renewable percentage.
Unit. The selection list only populates after you have chosen a type, and only shows the units applicable to that type. You enter heating oil in liters or kilograms, pellets in kilograms. If there is only one possible unit, it will be selected automatically.
For gas, kWh is the only unit. That figure is on your annual statement. Your gas meter shows cubic meters, but the conversion to kWh depends on the composition of the gas and varies by region and month. Your grid operator has already performed this conversion correctly on your invoice, so we use that instead of estimating it ourselves.
Input. Two buttons: Annual total or Per month. Annual total is the standard method. Per month is optional and described under Consumption per month.
Quantity. The number as it appears on your invoice or meter reading. The chosen unit appears behind the field, so you can see what you are entering.
Meter number. Optional. Useful if you have multiple meters of the same type, for example two inverters of different brands. It does not affect the calculation.
If you save a measurement in a year that has already been published, the platform will first ask for confirmation. See Publishing.
Heat pump: entering SCOP
If you choose Heat Pump as the type, an additional mandatory field appears: SCOP. This is the seasonal coefficient of performance, or how much heat your pump delivers on average per unit of electricity. An SCOP of 3.5 means 3.5 kWh of heat per 1 kWh of electricity.
You can find this figure on the technical data sheet or on your installer’s quote. Without the SCOP, the platform cannot calculate which part of your heat counts as renewable.
Wood or pellets
If you burn wood or pellets, choose Biomass (wood/pellet) and enter your fuel consumption. If you have a heat meter (calorimeter) on your boiler, you can also choose Biomass with heat measurement and enter the heat delivered in kWh.
Use only one of the two for the same boiler. If you enter your fuel for the second type, or your heat for the first, your total will no longer be correct.
The difference lies in the strict renewable percentage according to EPC/NR: there, heat from biomass only counts if it is measured. For your CO₂ and your regular renewable percentage, biomass counts in both cases. See How we calculate.
Solar panels: yield and injection
There are two separate types for solar panels, and you need both if you feed back into the grid:
- Own solar energy is the total yield of your panels, including the part you consume yourself. You can find this figure in your inverter’s app.
- Electricity injection to grid is the surplus you have fed back. This is on your statement or on Mijn Fluvius.
If you only enter the injection, you underestimate your own production. If you only enter the yield, the part fed back is incorrectly counted as your own consumption.
Entering injection is not a minor detail. The electricity you feed back is subtracted from your consumption. If you leave it out, your total will be too high and your renewable part will be too high, so your renewable percentage will be incorrect in two ways. You can find the figure on Mijn Fluvius. See How we calculate.
Present but not measurable
Sometimes you have an energy source where you cannot measure consumption, for example a wood stove where you don’t know how much you’ve burned. In that case, check Not measured this year. The quantity field will then be disabled.
The source then counts as unknown instead of zero. That is more accurate: zero would mean you consumed nothing, which would distort your renewable percentage and your CO₂ figure.
Reading the table
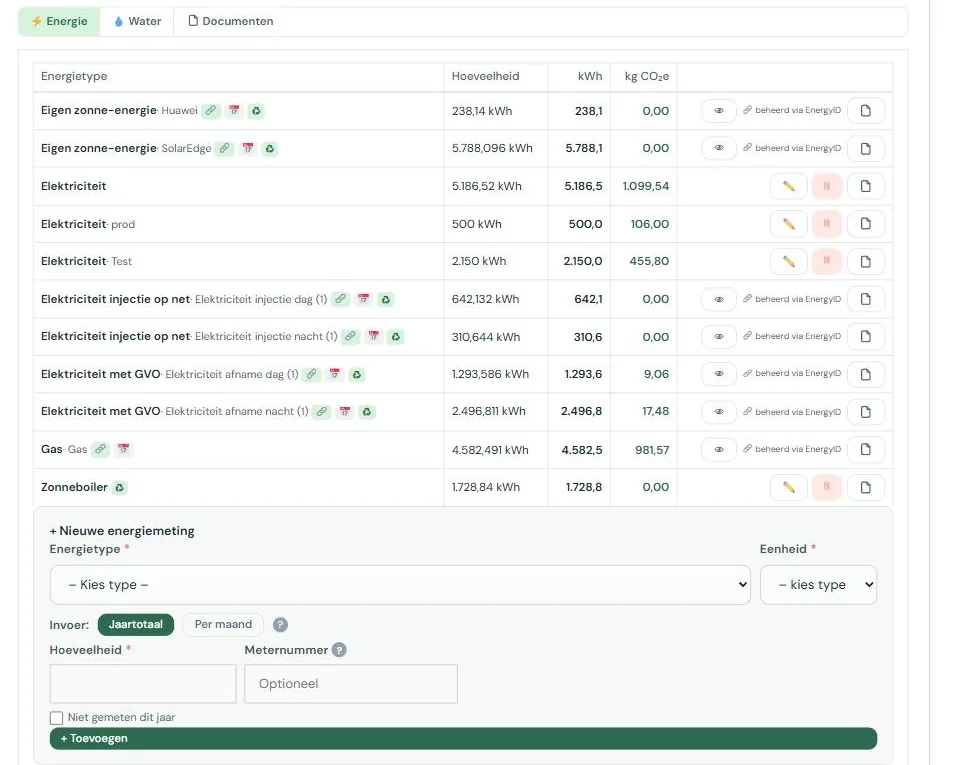
The table shows the energy type, the quantity, and what the platform calculated from that in kWh and kg CO₂e for each measurement. Small symbols may appear behind the name:
| Symbol | Meaning |
|---|---|
| 🔗 | Automatically filled from EnergyID |
| 📅 | The annual total is the sum of the entered months |
| ♻ | Counts as renewable |
| ⚠ | This type has both manual and EnergyID data; both are counted, so possibly double |
| EPC X | This energy type cannot be processed in the EPC/NR calculation |
| X not measured | Present, but consumption is unknown |
That orange triangle deserves attention. It means that for the same energy type, you have both a manual measurement and an EnergyID measurement. The platform adds them both up, so your annual total is then likely too high. In that case, remove the manual measurement, or remove the meter in the EnergyID block.
Water measurements
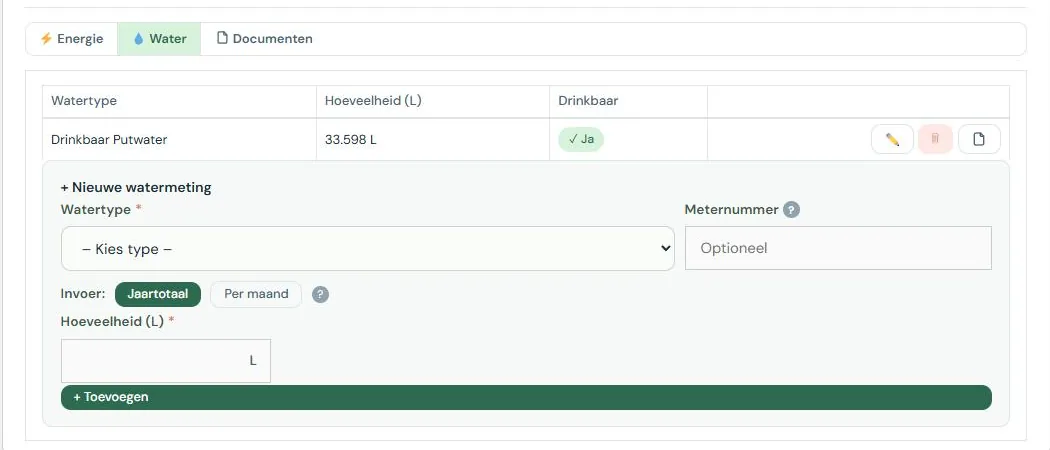
The Water tab works the same way, with three differences. You choose a water type instead of an energy type, the unit is fixed at liters, and the table shows a Potable column instead of kWh and CO₂e.
Drinking water, rainwater, and groundwater are separate types. That distinction matters: the benchmark primarily looks at your drinking water consumption, because using rainwater instead of drinking water is exactly what you want to achieve.
On your water bill, consumption is usually stated in cubic meters. One m³ is 1,000 liters.
Changing or deleting measurements
Behind each manual measurement are three buttons: edit, delete, and a document button with a counter. Use the latter to attach an invoice or meter reading to the measurement. See Documents and evidence.
Measurements managed by EnergyID cannot be edited or deleted. They show “managed via EnergyID” and an eye button to view the monthly data. If you still want to adjust such a measurement, first remove the meter in the EnergyID block.
Common mistakes
- Entering the number from your gas meter instead of your invoice. The meter shows cubic meters, the platform expects kWh. The difference is roughly a factor of twelve, so this will stand out in your results. Copy the annual consumption in kWh from your statement.
- Forgetting injection. Without an injection figure, it looks like you consumed all your solar power yourself.
- Entering part of the year. A measurement should always cover the full reporting period. If you only have part of it, use the monthly entry.
- Including private consumption without filling in the private percentage. If you live in the same building, check if the private use percentage in your accommodation details is correct.
Read more
Monthly consumption
Laatste update: 02/11/2026
In addition to a yearly total, you can also enter your consumption per month. This is not mandatory. It is useful if you want to see when you consume, not just how much.
Where to find it
- Open the year you want to fill in, in the Years tab.
- Choose the Energy or Water tab.
- In the entry form, set the Input option to Per month. A grid with twelve fields will then appear.
For a measurement coming from EnergyID, you can view the months using the eye icon on the row for that measurement.
When it is useful
- You suspect that something is running out of season that shouldn’t be.
- You want to know how much of your consumption is related to heating.
- You have taken a measure halfway through the year and want to see the effect.
- Your data comes from EnergyID; in that case, you already have monthly figures anyway.
If you just want to know your footprint, the yearly total is sufficient.
Entering monthly values
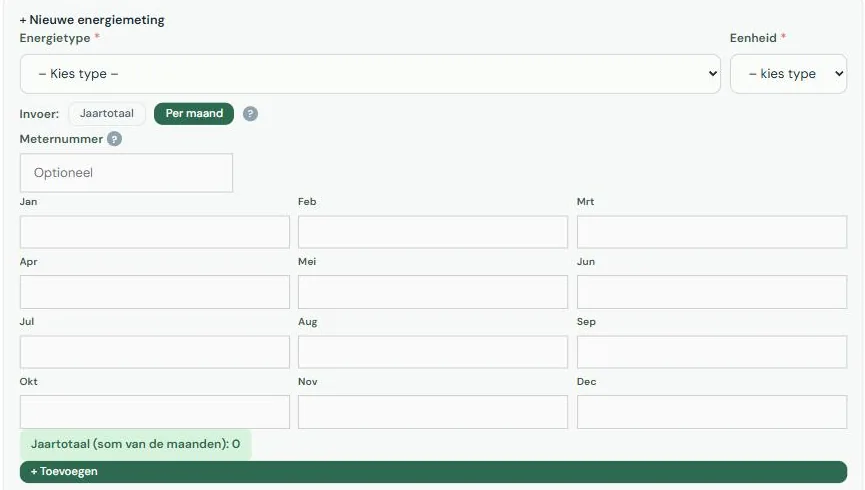
For an energy or water measurement, you choose at the top between Yearly total and Per month. If you choose per month, a grid with twelve fields appears. You don’t have to fill in all months.
The yearly total then becomes the sum of the months. If you switch back to yearly total while the year field is still empty, the platform takes the sum as a suggestion.
In the measurements table, you can recognize such a measurement by a calendar icon: the yearly total is built up from months.
Warning for a deviating month
If a month deviates significantly from the months next to it, you will receive a notification. This doesn’t block anything. Often there is a good reason, sometimes it’s just a comma or one zero too many.
You see that notification in the entry form. If your figures come from EnergyID, you never open that form. For that, there is an email that performs the same check, per meter, as soon as there is a later month with figures. The platform administrator enables that email. See Emails you can receive.
With EnergyID
Measurements coming from EnergyID always have monthly data. You cannot edit them, but you can view them using the eye icon next to the measurement. That screen shows the months per meter separately, so two inverters remain two lines.
Why monthly figures per guest night are an approximation
Your occupancy per month comes from Statbel, and Statbel counts a stay in the month in which the guest departs. A guest staying from December 28 to January 3 counts entirely towards January.
On a yearly total, this levels out. On a monthly level it doesn’t: December then seems emptier and January fuller than they actually were. That’s why we label monthly figures per guest night as indicative. They are fine for the pattern, but not for an exact value.
Read more
Auto-fill via EnergyID
Laatste update: 02/11/2026
If your consumption is already in EnergyID, you don’t need to type anything here. You link your account once, choose which meters to include, and then the platform retrieves your figures automatically.
Where to find it
- Open your accommodation and go to the Years tab.
- Scroll to the bottom, past the list of years, to the Auto-fill via EnergyID block.
- Or click the 🔗 EnergyID button at the top right, which will take you to the same block.
What EnergyID is
EnergyID is an independent platform where you collect your energy and water consumption, for example automatically via your digital meter or via your inverter. Many operators already use it. We read that data; we don’t write anything to it.
Linking your account
In the footprint screen, at the bottom of the Years tab, you’ll find the Auto-fill via EnergyID block with the Link my EnergyID account button. This takes you to EnergyID, where you log in and give permission yourself. We don’t see your password. Only the owner of the accommodation can link the account.
An accommodation retrieves its figures from exactly one EnergyID account. If you have multiple accommodations on the same account, you don’t need to log in again: for the next accommodation, choose the account under Use an account you already linked and click Use this account. If an accommodation belongs to a different account, choose Link another EnergyID account.
After linking, you can see which account the accommodation is connected to, how many meters are linked, when the data was last updated, and if everything is in order.
If you share the accommodation
A co-manager with write access can see in the EnergyID block if the accommodation is linked and which meters are included, and can click on Retrieve data. Only the owner can choose meters, switch accounts, or disconnect, and the content of the owner’s EnergyID account remains hidden from others. Those with read-only access won’t see the block. See Sharing your accommodation with a colleague.
If the accommodation is transferred to a new owner, the platform administrator decides whether the retrieval stops or continues temporarily on the previous owner’s account. In the latter case, you will see this in the EnergyID block. As the new owner, link your own account using Link my own EnergyID account.
Choosing meters
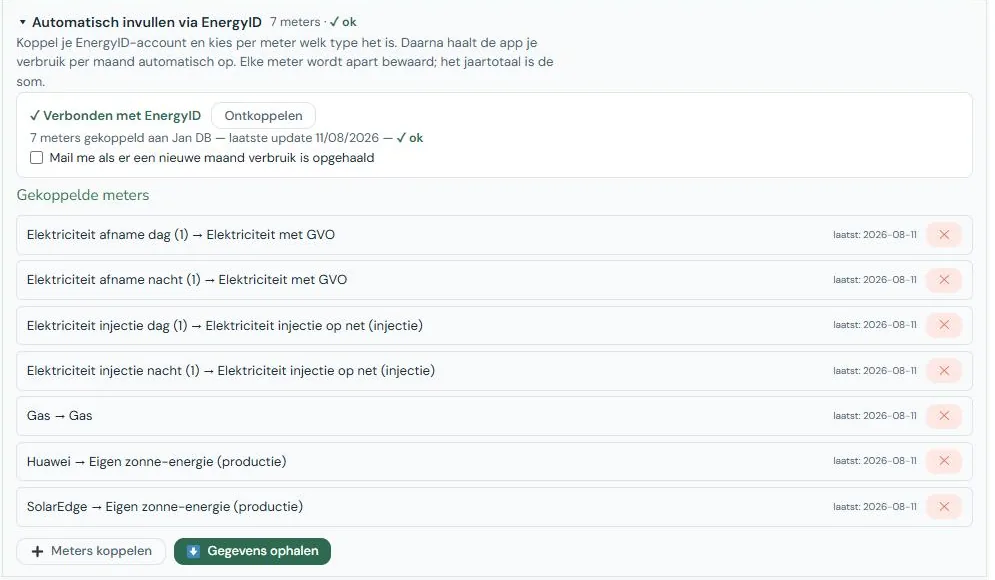
An EnergyID account often contains more meters than are relevant for your accommodation. So you choose them yourself, and you indicate the energy type for each meter. The platform makes a suggestion based on what EnergyID reports, but you confirm it.
Meters that are already linked are marked as such, so you don’t accidentally link the same one twice.
If you have two inverters of different brands, link them both separately. Each meter is saved individually, with its name, so you can see later which one supplied what.
Retrieving data
With the Retrieve data button, you import your figures from the oldest year you already have in the platform up to today. If you don’t have any years yet, the platform starts three years back. The platform automatically creates years for which EnergyID has figures but which don’t exist yet. Published years remain as they are. After that, it happens automatically: weekly by default, but this can also be set to daily or monthly.
The automatic retrieval only looks at the previous and current year, as older years no longer change. You can update older years using the button.
Want to import older figures? First, create the year from which you want to import (see Creating a reporting year) and then click Retrieve data. The years in between will then be created and filled in. Choose a year for which EnergyID already has figures, and don’t go back further than ten years. You fill in the occupancy for those years yourself.
If nothing changes, nothing is rewritten. Your figures are only updated if there is an actual difference, and a line is added to the history.
Measurements from EnergyID are read-only
A measurement managed by EnergyID cannot be edited or deleted. It appears in the table with the note managed via EnergyID and an eye button to view the monthly data.
If you still want to adjust such a measurement manually, first remove the meter in the EnergyID block. This will remove the data for that meter from your unpublished years; published years remain as they are.
If you have both a manual measurement and an EnergyID measurement for the same energy type, both will be counted, making your annual total too high. You will see a warning sign in the measurements table for this. Delete the manual measurement or remove the meter in the EnergyID block.
Emails about your connection
You may receive two types of messages. If your connection has expired, you will receive a one-time email listing the EnergyID account and the accommodations that are affected; until you reconnect, the platform will no longer retrieve anything for those accommodations. Click Reconnect in the EnergyID block: this restores all accommodations on that account at once. You can also receive a message when new monthly figures have been retrieved. The latter is turned off by default; you can turn it on by checking the box in the EnergyID block. See Emails you can receive.
Disconnecting
With Disconnect this accommodation, retrieval stops for this accommodation. The retrieved figures and chosen meters remain, and your other accommodations stay linked.
If you really want to remove a meter’s figures, delete that meter with ✕. Its data will then disappear from your unpublished years; published years remain as they are, and a line is added to the history. After that, you can fill in that consumption manually again.
An EnergyID account that you no longer use anywhere can be removed under Manage linked EnergyID accounts. This appears in the EnergyID block as long as the accommodation is not linked. Accommodations that are still retrieving via that account will then be disconnected; their figures will remain.
Read more
Publishing and requesting a check
Laatste update: 02/11/2026
Publishing means: this year is finished, and it can be included anonymously in the comparison. Only after publishing will you see where you stand compared to other accommodations, and only then does your accommodation count for someone else.
Where to find it
- Open your accommodation and go to the Years tab.
- Click to open the year you want to publish.
- Click on Publish in the button row for that year.
If the button is greyed out, the year hasn’t ended yet. You can’t publish the current year.
What publishing does and doesn’t do
Publishing does not make your figures public. No one ever sees your consumption, your occupancy, or your name. What happens is that your result per person-night is added anonymously to the calculation group. See Comparing without revealing your data.
What it does do: you get access to the benchmark, and you can create a report and an infographic.
Which year you can publish
Only a completed year. You can’t publish the current year, even if it’s almost over. Publishing half a year would create a skewed average in the comparison group and would make your own year-on-year comparison unusable.
In practice, you publish the year that has just ended starting from January.
Before you publish
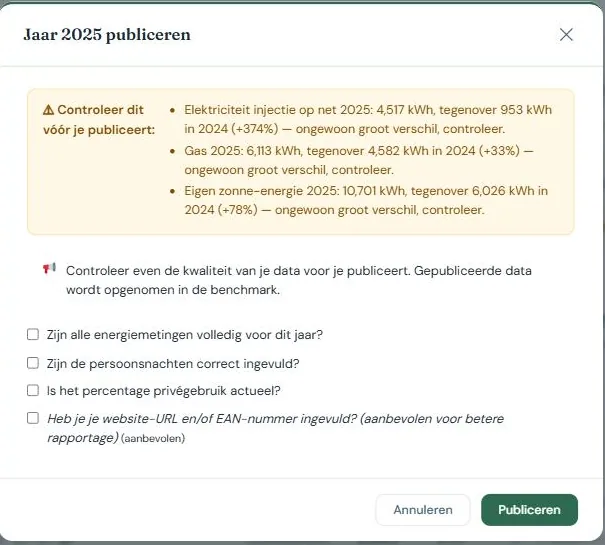
The platform checks a few things and shows what stands out. Those notifications don’t block anything; they just ask for a moment of your attention.
Possible double counting of electricity. If you have consumption listed under both “Electricity (Grey)” and “Electricity (Green with GO)”, it’s often the same power being counted twice. If it is correct—for example, because you switched contracts halfway through the year—you can go right ahead.
An unusually large difference compared to another year. If an energy or water type deviates by more than a quarter from the year before or after, you’ll see that with both figures shown. Usually, there’s a good reason (a cold winter, a new heat pump, a vacant season). Sometimes it’s a typo or the wrong unit.
Additionally, there is one thing that does block: your accommodation must be found at Visit Flanders based on your address. If that fails, check your address details and retrieve them again using the green button in your accommodation details.
Also, double-check for yourself if all energy measurements are complete, if your person-nights are correct, and if your private use percentage is still up to date.
Republishing
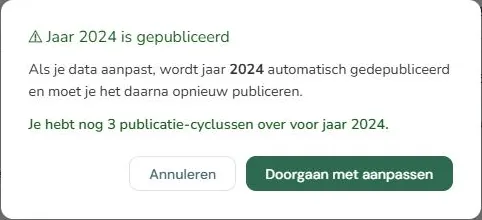
You can republish a year, but not indefinitely: three times by default. The reason is the cost of recalculating. With every publication, your report is rebuilt, including the AI analysis, which costs both money and energy. The platform reuses existing results where possible; this limit is part of that same choice. See A platform that takes its own footprint seriously.
You’ll get a warning on your last available turn. If you have a good reason to publish more often, you can request an exception.
If you change data for a year that has already been published, that year is automatically unpublished and you use a publication turn when you republish it. The platform therefore asks for confirmation before it processes a change in a published year.
Requesting a check
Besides publishing, you can request a check. Someone from Fair Hospitality will then check your figures for improbabilities before they count permanently. This is optional and free.
Useful if it’s your first year, if you’re unsure about a conversion, or if you want to use the figures externally and be certain.
Unpublishing
If you discover an error later, you can unpublish a year, correct it, and publish it again. Keep the counter in mind: that also costs a turn.
Read more
Your evolution and the benchmark
Laatste update: 02/11/2026
A figure on its own doesn’t say much. 42 kWh per person per night is a lot or a little, depending on what similar accommodations consume and what you did last year. There are three views for this.
Where to find it
- Open your accommodation and click on the Benchmark tab.
- At the top, choose who you want to compare with: reference group, type of accommodation, and region.
- Use the buttons below to switch between Evolution vs benchmark, External benchmark, and My accommodation.
How the comparison group is formed
The group consists of published years from other accommodations, filtered by what is comparable, such as the same accommodation type.
There is a lower limit: if there are fewer than three accommodations in a group, nothing is shown, as you could then deduce who consumes what from one or two other accommodations. The bar is set higher for the report. If a year doesn’t reach that size, previous years are included, going back up to three years.
If the group is too small, you will see this explicitly stated instead of a figure that lacks sufficient data.
Evolution over the years
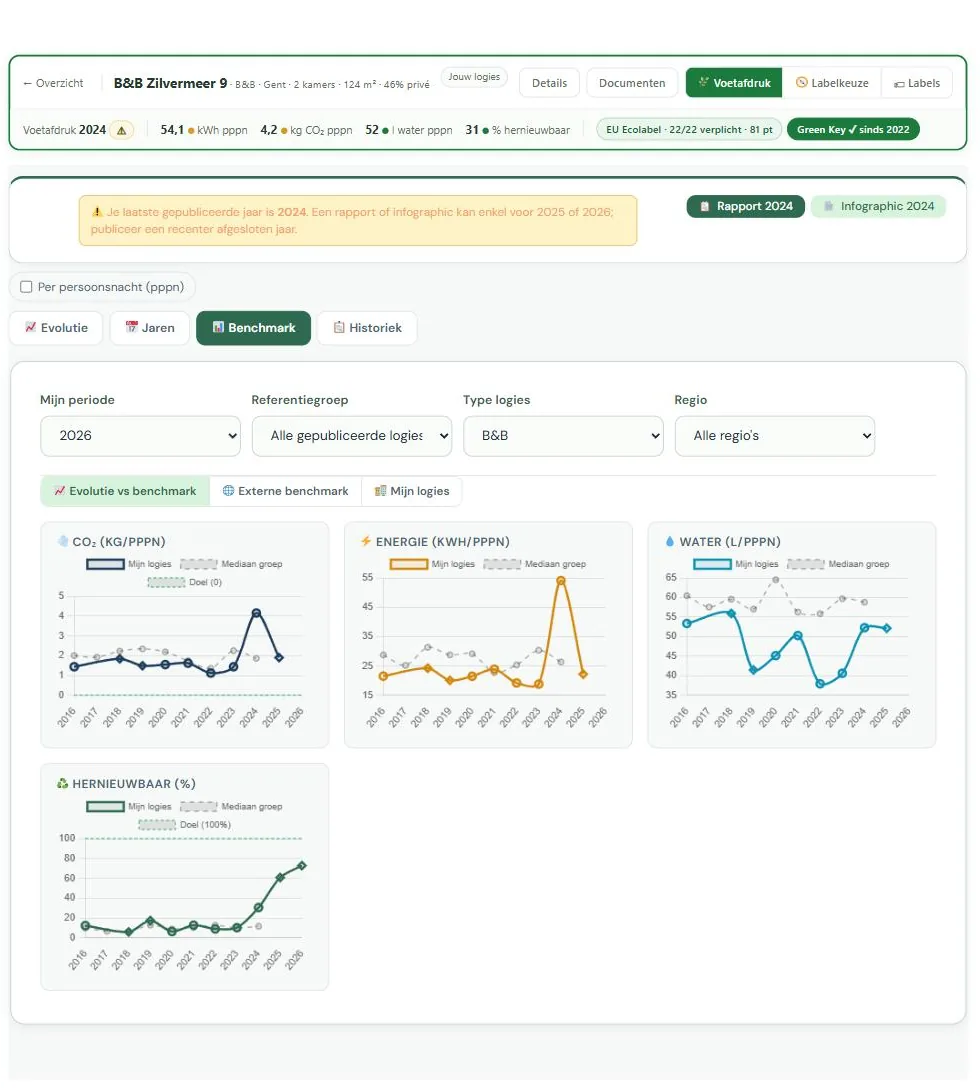
The first view places your figures side by side per year, with the benchmark as a background. Here you can see if you are moving, and in which direction.
This is usually the most useful view, because you are comparing yourself with yourself. Differences between accommodations have a thousand causes (year of construction, insulation, swimming pool, restaurant); differences between your own years usually only have a few.
The spider web comparison
A spider web shows several indicators at once: energy, CO₂, water, share of renewables. This allows you to see at a glance where your strengths and weaknesses lie.
Useful for deciding what to work on first. If you score well on energy but poorly on water, you know where the gains are.
Comparing your own accommodations with each other
If you have multiple accommodations, you can put them side by side. Useful to see if a measure that worked for one would also yield results for another.
Reading percentiles
Your position is expressed in percentiles, not in a ranking. A percentile tells you what percentage of comparable accommodations are performing worse than you.
| Color | Meaning |
|---|---|
| Green | You are among the top 33% |
| Orange | You are in the middle bracket |
| Red | You are in the bottom 33% |
High is always good, including for CO₂ and water. The platform reverses the scale where necessary, so you never have to think about whether a high number is good or bad.
The report and the infographic summarize your percentiles on the four core figures into one average. You can read about what “X% best-scoring accommodations” and the medal there mean, and why the infographic sometimes shows no position, under Report and infographic.
Red doesn’t mean you’re doing poorly. It means there is room for improvement. An accommodation from 1900 with single glazing simply scores differently than a new build, and that is exactly why you should primarily look at your own evolution.
Monthly detail
If you have entered monthly data, you can compare by month. This makes seasonal patterns visible: a peak in winter points to heating, a peak in summer rather to cooling or more guests.
Note when interpreting: monthly figures per person-night are an approximation, because the occupancy per month is based on the guest’s departure date. It suffices for the pattern, but not for an exact value. See Consumption per month.
Why you don’t see names
You never see which accommodation is behind which figure, and no one sees yours. This is not a limitation but the condition under which operators are willing to share their figures. Without that agreement, there would be no benchmark.
Read more
Report and infographic
Laatste update: 02/11/2026
From your published figures, the platform creates two things: a report with analysis and recommendations, and an infographic that you can share with your guests.
Where to find it
- Open your accommodation. The Report and Infographic buttons are at the top, with the year included.
- If nothing has been published yet, they are not available and you will see a notification.
The file opens in a new tab and is simultaneously saved in your documents.
When you can create a report
You need at least one published year. The buttons are at the top of the footprint screen, with the year included so you can see which year is being used.
The report always uses your last published year, not the current one. The current year is by definition incomplete and cannot be published. If your last publication is older, you will see a gentle reminder to publish a more recent year.
If you have just uploaded documents that are still being processed, the platform will first ask if you want to proceed anyway. If you continue, the report will not yet take those documents into account, and a new version will be created later. If you wait a moment, the report will include them immediately.
What is in the report
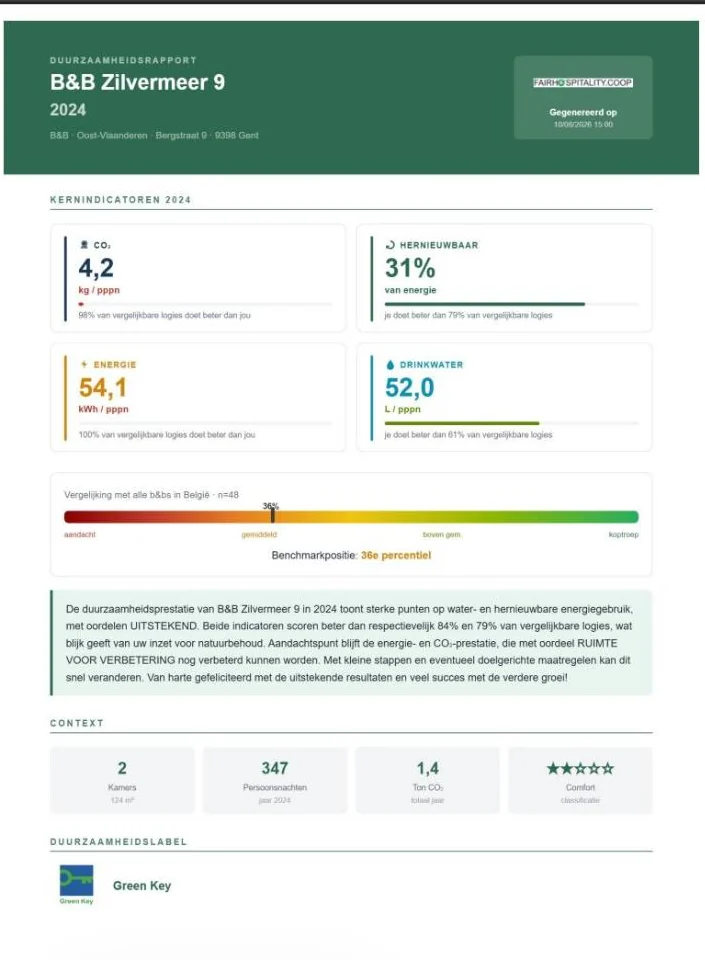
Your key figures and your position in the benchmark, your evolution over the years, and an analysis per theme: energy saving, water management, your sustainability label, and how your website communicates about sustainability.
If you have set goals, the section Your goals and next steps will appear on the first page, immediately after your key figures: for each goal, your starting point, what you want to achieve, where you stand now, and how far along you are. You set goals in the certification module, under criterion 1; see Worksheets and checklists. If you have none, that section remains empty.
The CO₂ figures also include the extraction and transport of your fuels, not just the combustion at your location; see How we calculate. If you have multiple meters of the same type, for example two inverters, the name of each meter is listed in small print after the energy type.
The analysis is written by an AI based on your figures, the documents you have uploaded, and your website. It does not invent numbers: everything it mentions comes from your own data.
The recommendations are suggestions, not an inspection. You know better than a model whether a measure is feasible in your building.
The infographic
A one-page visual with your most important figures, intended for sharing: on your website, in your welcome folder, on social media. You don’t need to set anything up for it.
The sentence at the bottom of the infographic
At the bottom is a single sentence about your performance. Which sentence it becomes depends on your figures:
- A position in the benchmark. If you score better than half of your comparison group, and that group includes at least ten different accommodations, it will say “This accommodation is among the top X% of scoring accommodations”. If you are at the top of everything, it becomes “scores best in its comparison group”.
- Your own progress. If that’s not possible, the sentence compares with your previous published year, based on the measurement where you improved the most: CO₂, energy, or water per overnight stay, or your share of renewable energy. This only happens if there is a clear difference, and never if your CO₂ per overnight stay increased by 5% or more. If that previous published year is not the year before, the sentence mentions the year: “than in 2023” instead of “than last year”.
- A neutral sentence. Otherwise, it says “This accommodation measures its footprint and shares the figures openly”.
The medal depends on the same figure as the report: the average of your percentiles on the four key figures. Gold from 90, silver from 80, bronze from 70, and only if your comparison group includes at least ten different accommodations. Most accommodations do not receive a medal; that is how it’s intended.
“Top X%” is not a literal ranking. It is 100 minus that average, a composite score. The report and infographic show the same figure, but the report also does so for a smaller group. Sometimes the report shows a position where the infographic remains silent.
Why a report is reused
Having a report made costs computing power and therefore energy and money. That is why the platform saves the result: if your data hasn’t changed, you get the existing report back instead of a new one. If something substantial does change, a new version is created.
This is the same choice as the limit on the number of publications. See A platform that takes its own footprint seriously.
Report and infographic are added to your documents
Both are automatically saved as a document for your accommodation. If you create a new version later, it will appear alongside it as a new version; the old one remains in the history. This way, you can always find what you communicated last year. See Documents and evidence.
Read more
History and notes
Laatste update: 02/11/2026
Every change to your accommodation is tracked. This is handy if you’re wondering when something changed, or who did it.
Where to find it
- Open your accommodation and click on the History tab.
- At the top, there’s a field to add a note yourself.
- Below that is the list of what has been automatically tracked, including the date and name.
What is being tracked
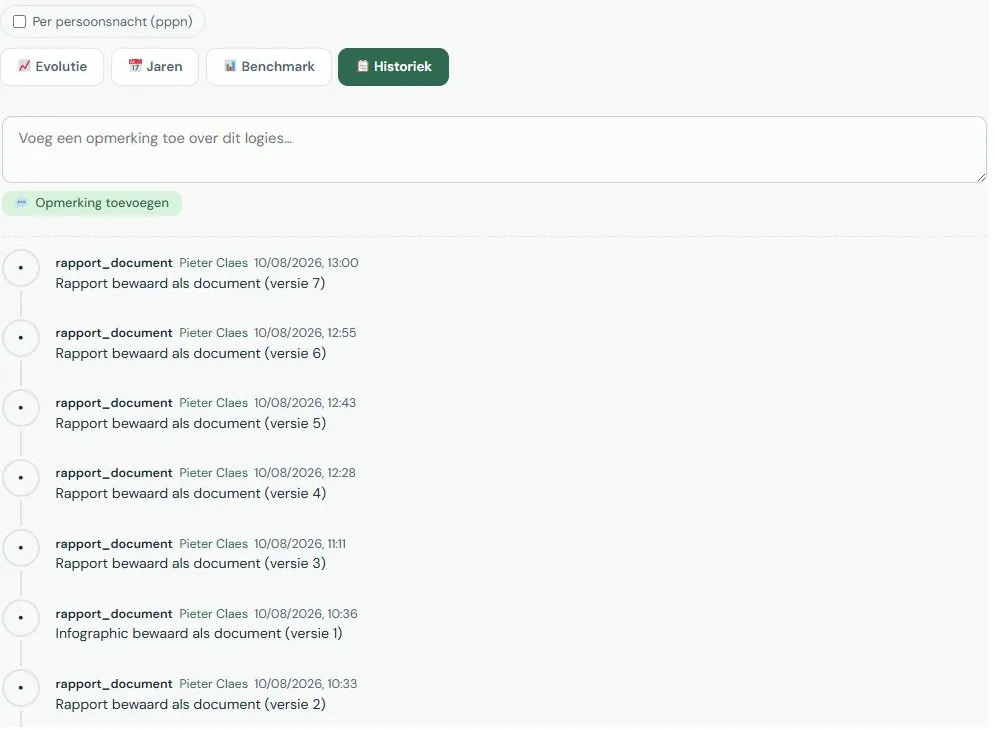
Changes to your accommodation details, created and deleted years, publishing and unpublishing, data automatically retrieved from EnergyID, linked and unlinked meters, and documents that have been added or replaced.
Each line shows when it happened and by whom. If you share your accommodation with someone else, you’ll also see what that person did.
Adding a note
You can add a note to the history yourself. This is useful for recording something you might forget later: why a figure differs, what assumption you made for an estimate, or that the boiler was replaced in March.
A note about an unusual figure can save you half an hour of searching next year. Especially if someone else is reviewing it.
Who sees the history
You and the users you share the accommodation with. The history is never included in the benchmark and is not visible to other operators.

