
Laatste update: 02/11/2026
In addition to a yearly total, you can also enter your consumption per month. This is not mandatory. It is useful if you want to see when you consume, not just how much.
Where to find it
- Open the year you want to fill in, in the Years tab.
- Choose the Energy or Water tab.
- In the entry form, set the Input option to Per month. A grid with twelve fields will then appear.
For a measurement coming from EnergyID, you can view the months using the eye icon on the row for that measurement.
When it is useful
- You suspect that something is running out of season that shouldn’t be.
- You want to know how much of your consumption is related to heating.
- You have taken a measure halfway through the year and want to see the effect.
- Your data comes from EnergyID; in that case, you already have monthly figures anyway.
If you just want to know your footprint, the yearly total is sufficient.
Entering monthly values
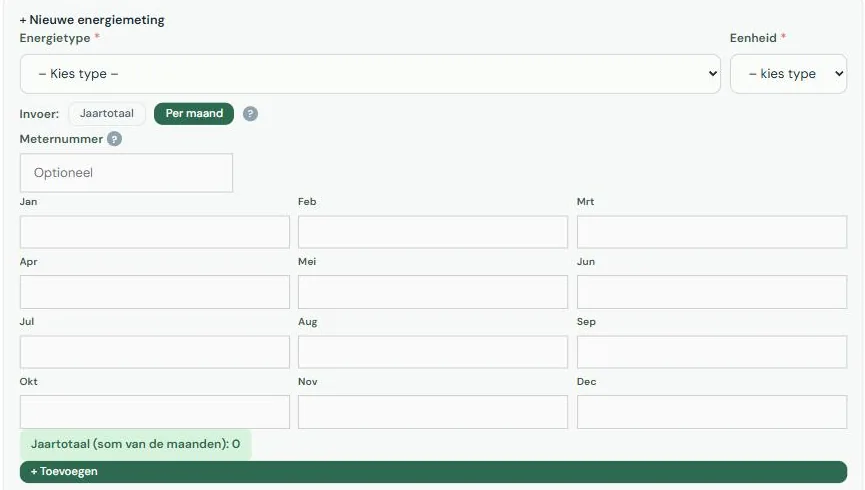
For an energy or water measurement, you choose at the top between Yearly total and Per month. If you choose per month, a grid with twelve fields appears. You don’t have to fill in all months.
The yearly total then becomes the sum of the months. If you switch back to yearly total while the year field is still empty, the platform takes the sum as a suggestion.
In the measurements table, you can recognize such a measurement by a calendar icon: the yearly total is built up from months.
Warning for a deviating month
If a month deviates significantly from the months next to it, you will receive a notification. This doesn’t block anything. Often there is a good reason, sometimes it’s just a comma or one zero too many.
You see that notification in the entry form. If your figures come from EnergyID, you never open that form. For that, there is an email that performs the same check, per meter, as soon as there is a later month with figures. The platform administrator enables that email. See Emails you can receive.
With EnergyID
Measurements coming from EnergyID always have monthly data. You cannot edit them, but you can view them using the eye icon next to the measurement. That screen shows the months per meter separately, so two inverters remain two lines.
Why monthly figures per guest night are an approximation
Your occupancy per month comes from Statbel, and Statbel counts a stay in the month in which the guest departs. A guest staying from December 28 to January 3 counts entirely towards January.
On a yearly total, this levels out. On a monthly level it doesn’t: December then seems emptier and January fuller than they actually were. That’s why we label monthly figures per guest night as indicative. They are fine for the pattern, but not for an exact value.

